Middle Earth: Creating the DEM System (peaks everywhere!)
How I turned a flat drawing into terrain that has real height, and makes the traveller pay for it.
The problem: a beautiful map that thinks the world is flat
Pete Fenlon’s map is beautiful, but for a computer it is just ink. It shows mountains: grey triangles, hatched ridges, the Misty Mountains running down the middle of the map. But it doesn’t know about them. There is no “this pixel is 1,400 m up”. For PostGIS, Mordor and the Shire were equally flat.
That’s a problem, because half of what makes travel in Middle-earth interesting is that going over the Misty Mountains is a bad idea and going around them takes weeks. Without elevation, my router would send a hobbit straight over Caradhras in sandals.
So I needed a DEM — a Digital Elevation Model. A grid where every point has a height. The problem: real DEMs come from satellites, and Middle-earth is not in orbit. I had to build one by hand.
Step 1: peaks everywhere
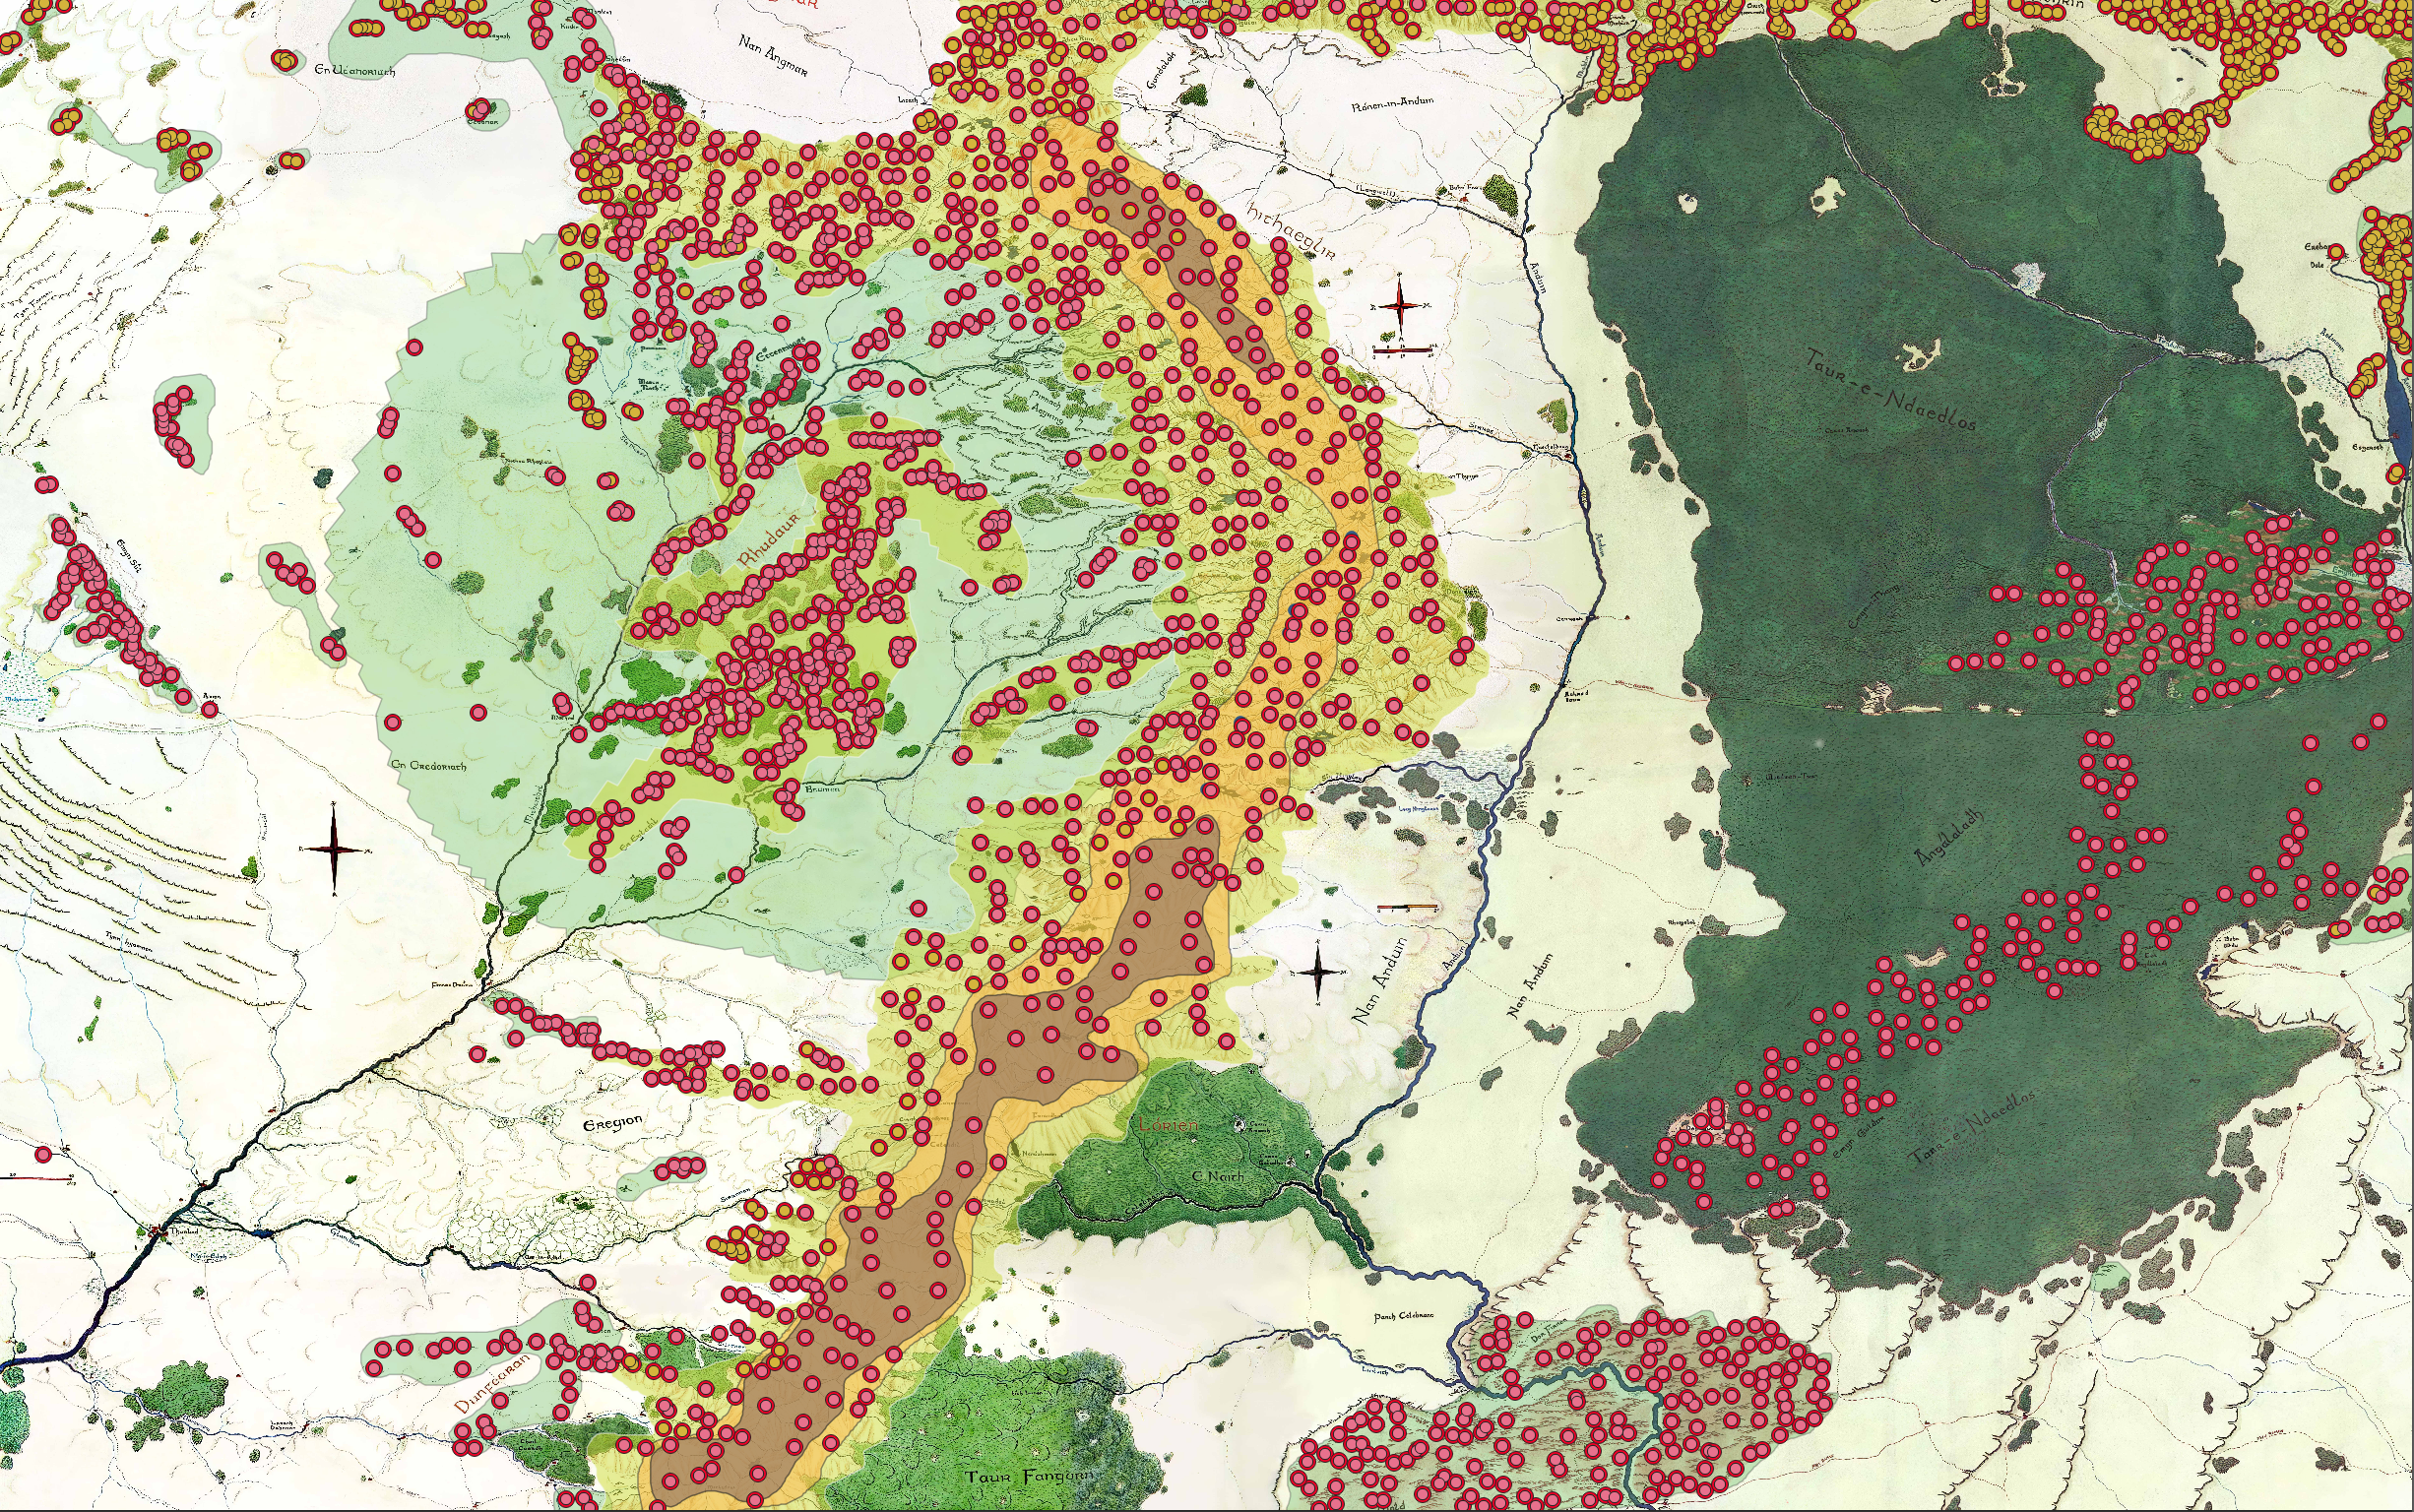
The raw material was points. Lots of points. I went across the map and marked elevation, ending up with 10,925 elevation points stored in the elevation_points table — each one a POINT with an altitude_type (plain, hills, low/mid/high mountains) and a computed elevation_final in metres.
This is the “peaks everywhere!” phase, and it was as tedious as it sounds. But points alone are not terrain. A traveller doesn’t walk on points, they walk on the slopes between them.
Step 2: altitude layers to give the points context
Alongside the points I drew altitude_layers — polygons for each altitude band (plains, hills, low mountains, mid mountains, high mountains). Each layer carries a priority field, which was crucial: mountains overlap hills overlap plains, and when a coordinate falls inside three polygons at once, priority decides who wins.
SELECT altitude_type
FROM altitude_layers
WHERE ST_Contains(geom, ST_SetSRID(ST_MakePoint($1, $2), 4326))
ORDER BY priority DESC
LIMIT 1;
So the polygons say what kind of ground it is, and the points say how high it gets.
Step 3: baking it into a raster
Points + polygons then get synthesised into an actual raster — a continuous elevation grid — stored in the dem_elevation table using the PostGIS Raster extension:
CREATE EXTENSION IF NOT EXISTS postgis_raster;

CREATE TABLE dem_elevation (
    rid      SERIAL PRIMARY KEY,
    rast     RASTER,               -- elevation values in metres
    metadata JSONB DEFAULT '{}'::jsonb,
    created_at TIMESTAMP DEFAULT NOW(),
    updated_at TIMESTAMP DEFAULT NOW()
);

CREATE INDEX idx_dem_elevation_rast
    ON dem_elevation USING GIST(ST_ConvexHull(rast));
The metadata JSONB column keeps notes on how each raster was generated (resolution, bounds, algorithm version) — useful when you regenerate it for the fifth time because the mountains looked wrong.
Step 4: the one function everything else leans on
All of that generation work ends up hidden behind one very boring SQL function:
CREATE OR REPLACE FUNCTION get_elevation_at_point(lon DOUBLE PRECISION, lat DOUBLE PRECISION)
RETURNS DOUBLE PRECISION AS $$
DECLARE elevation DOUBLE PRECISION;
BEGIN
    SELECT ST_Value(rast, ST_SetSRID(ST_MakePoint(lon, lat), 4326))
    INTO elevation
    FROM dem_elevation
    WHERE ST_Intersects(rast, ST_SetSRID(ST_MakePoint(lon, lat), 4326))
    LIMIT 1;
    RETURN COALESCE(elevation, 0);
END;
$$ LANGUAGE plpgsql STABLE;
Give it a longitude and latitude, get back a height in metres. That’s it. Every other elevation feature in the project is just this function called many times.
What the DEM actually powers
“How high am I standing?” — The /api/dem/elevation endpoint takes a lon/lat, returns the elevation and the terrain type from the altitude layers.
Elevation profiles — The /api/dem/profile endpoint takes a whole path and draws its cross-section. It interpolates points along the route every 100 metres, calls get_elevation_at_point for each one, and adds up elevation gain and elevation loss separately (climbing 300 m and then descending 300 m is not the same as walking on flat ground):
totalDistance, minElevation, maxElevation, elevationGain, elevationLossThat gain and loss number is what makes a mountain feel like a mountain: it feeds directly into how tiring the journey is.
Making routes honest — This is where “peaks everywhere” pays off. The routing engine multiplies travel speed by an altitude penalty, so the same distance can cost very different amounts of effort:
| Terrain | Walking speed multiplier | On horseback |
|---|---|---|
| Plain | ×1.00 | ×1.00 |
| Hills | ×0.80 | ×0.70 |
| Low mountains | ×0.65 | ×0.50 |
| Mid mountains | ×0.50 | ×0.30 |
| High mountains | ×0.35 | ×0.15 |
A horse in the high mountains moves at 15% of its speed on open ground. The lesson is simple: take the pass, not the peak.
Lessons from building fake terrain
- Points are data, slopes are meaning. The useful information sits between the measurements, which is why the interpolation and the raster mattered more than the points themselves.
- A tie-breaker column is not optional. Overlapping polygons are unavoidable on a hand-drawn map, and
priorityis what resolves them. - One clean function beats ten clever queries. Hiding all the raster complexity behind
get_elevation_at_point(lon, lat)meant the rest of the codebase never had to know how the raster was built.
Next: with the ground shaped, I had to decide what the weather on top of it should be. For that I went back to 1950. → How to create a Climate System from nothing