Middle-Earth Wandering Simulator
I have always been fascinated by fantasy maps, especially those with real geographic rigor. Pete Fenlon’s map for MERP (Middle Earth Role Playing), the tabletop RPG that ICE derived from Rolemaster and published throughout the 80s and 90s, is one of the most detailed and beautiful cartographic works in the history of role-playing games. I wanted to explore what would happen if that map stopped being decorative and became a living system.
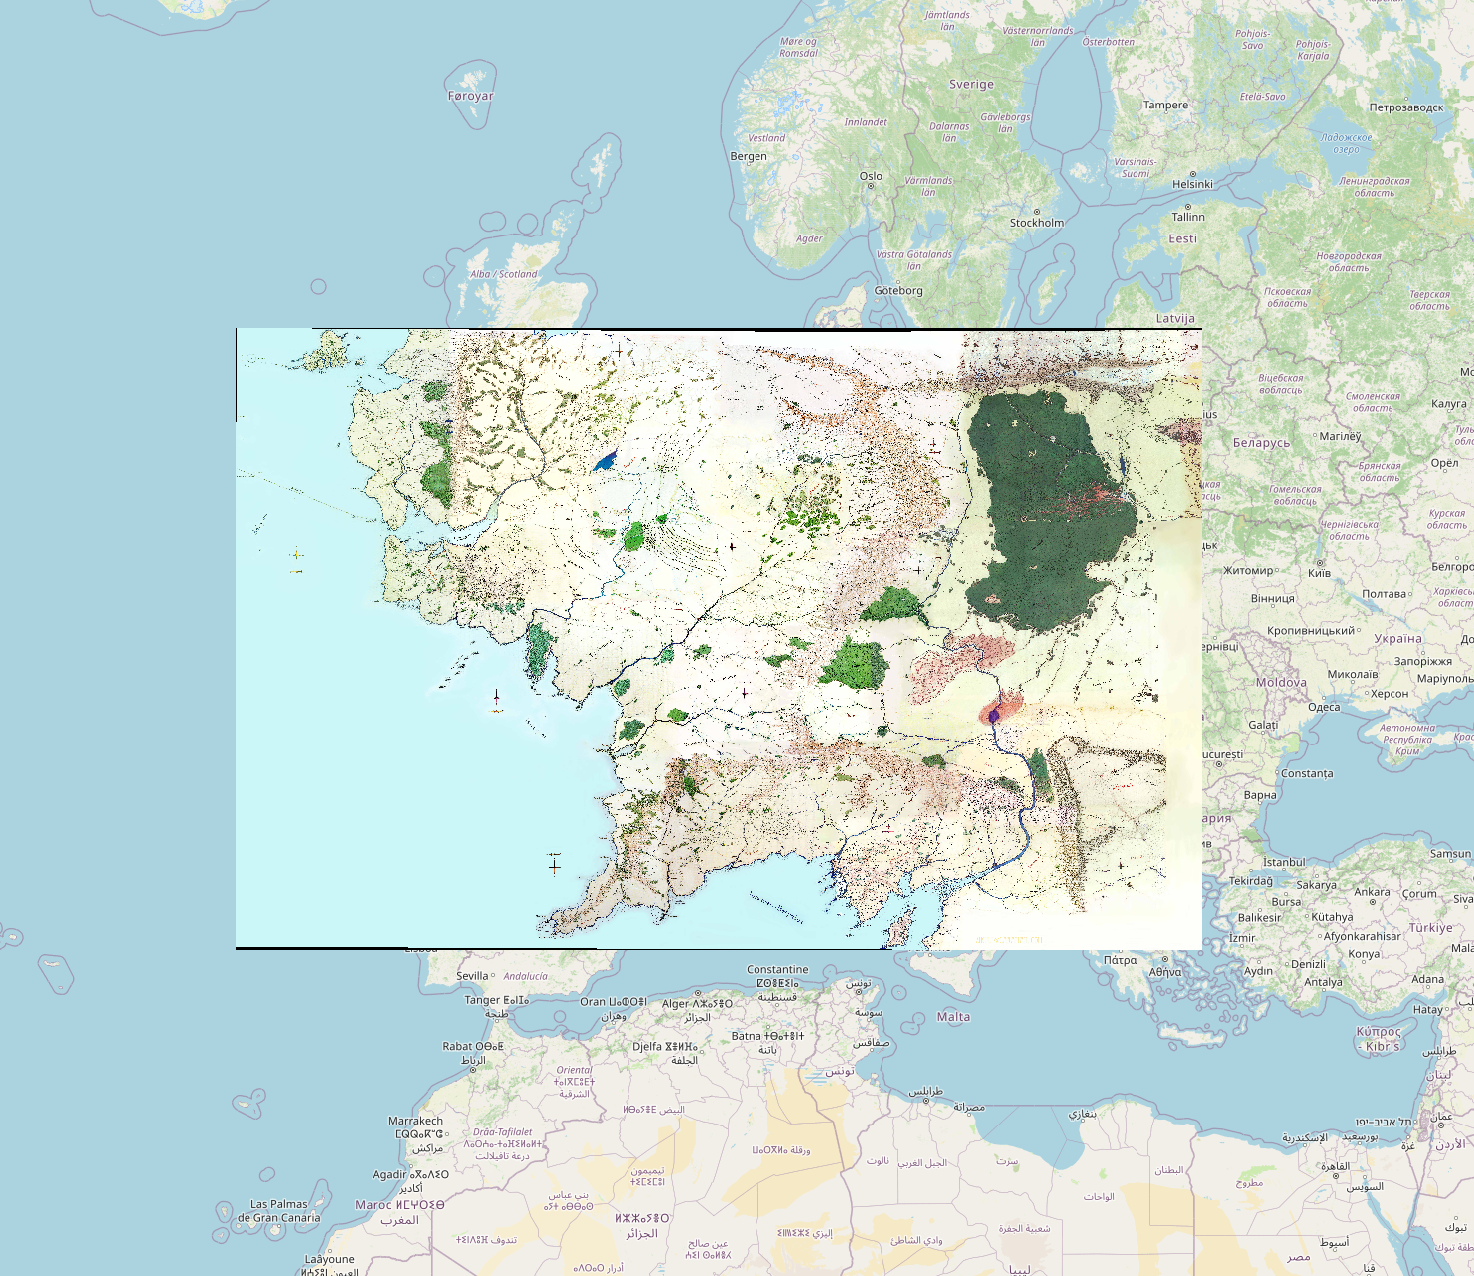
The result is the Middle Earth Wandering Simulator: Middle-earth georeferenced onto Europe with QGIS, inheriting real geographic coordinates (EPSG:4326 / WGS84) so it can measure distances, compute routes, simulate historical climates, and narrate AI-generated stories anchored in the map’s data.
The system models Middle-earth as real geospatial layers on top of PostGIS and exposes them through a Node.js REST API. The frontend (Vue 3) renders those layers over a vector map and lets you compute routes, simulate the passage of time and weather, and generate a daily AI narrative for a given journey. The project grew in layers: first the static geographic data, then the dynamic climate, then entities and regions, and finally the narration system.
Challenges
- Creating the DEM System (peaks everywhere!)
- How to create a Climate System from nothing
- Getting directions on Middle Earth (without passing through Mordor)
- Giving life to the map: entities and encounters
- Prompting and narrating like Tolkien from raw GIS data
- Survival, endings, and turning the narrator into an Interactive Story Engine
The starting point
The first challenge was getting Pete Fenlon’s map in high resolution and georeferencing it onto Europe using QGIS with real tiles and coordinates. Once it was geographically anchored, the project took its natural shape: if I have real coordinates, I can have real data, real climate, real elevation, computable distances.
Geographic data
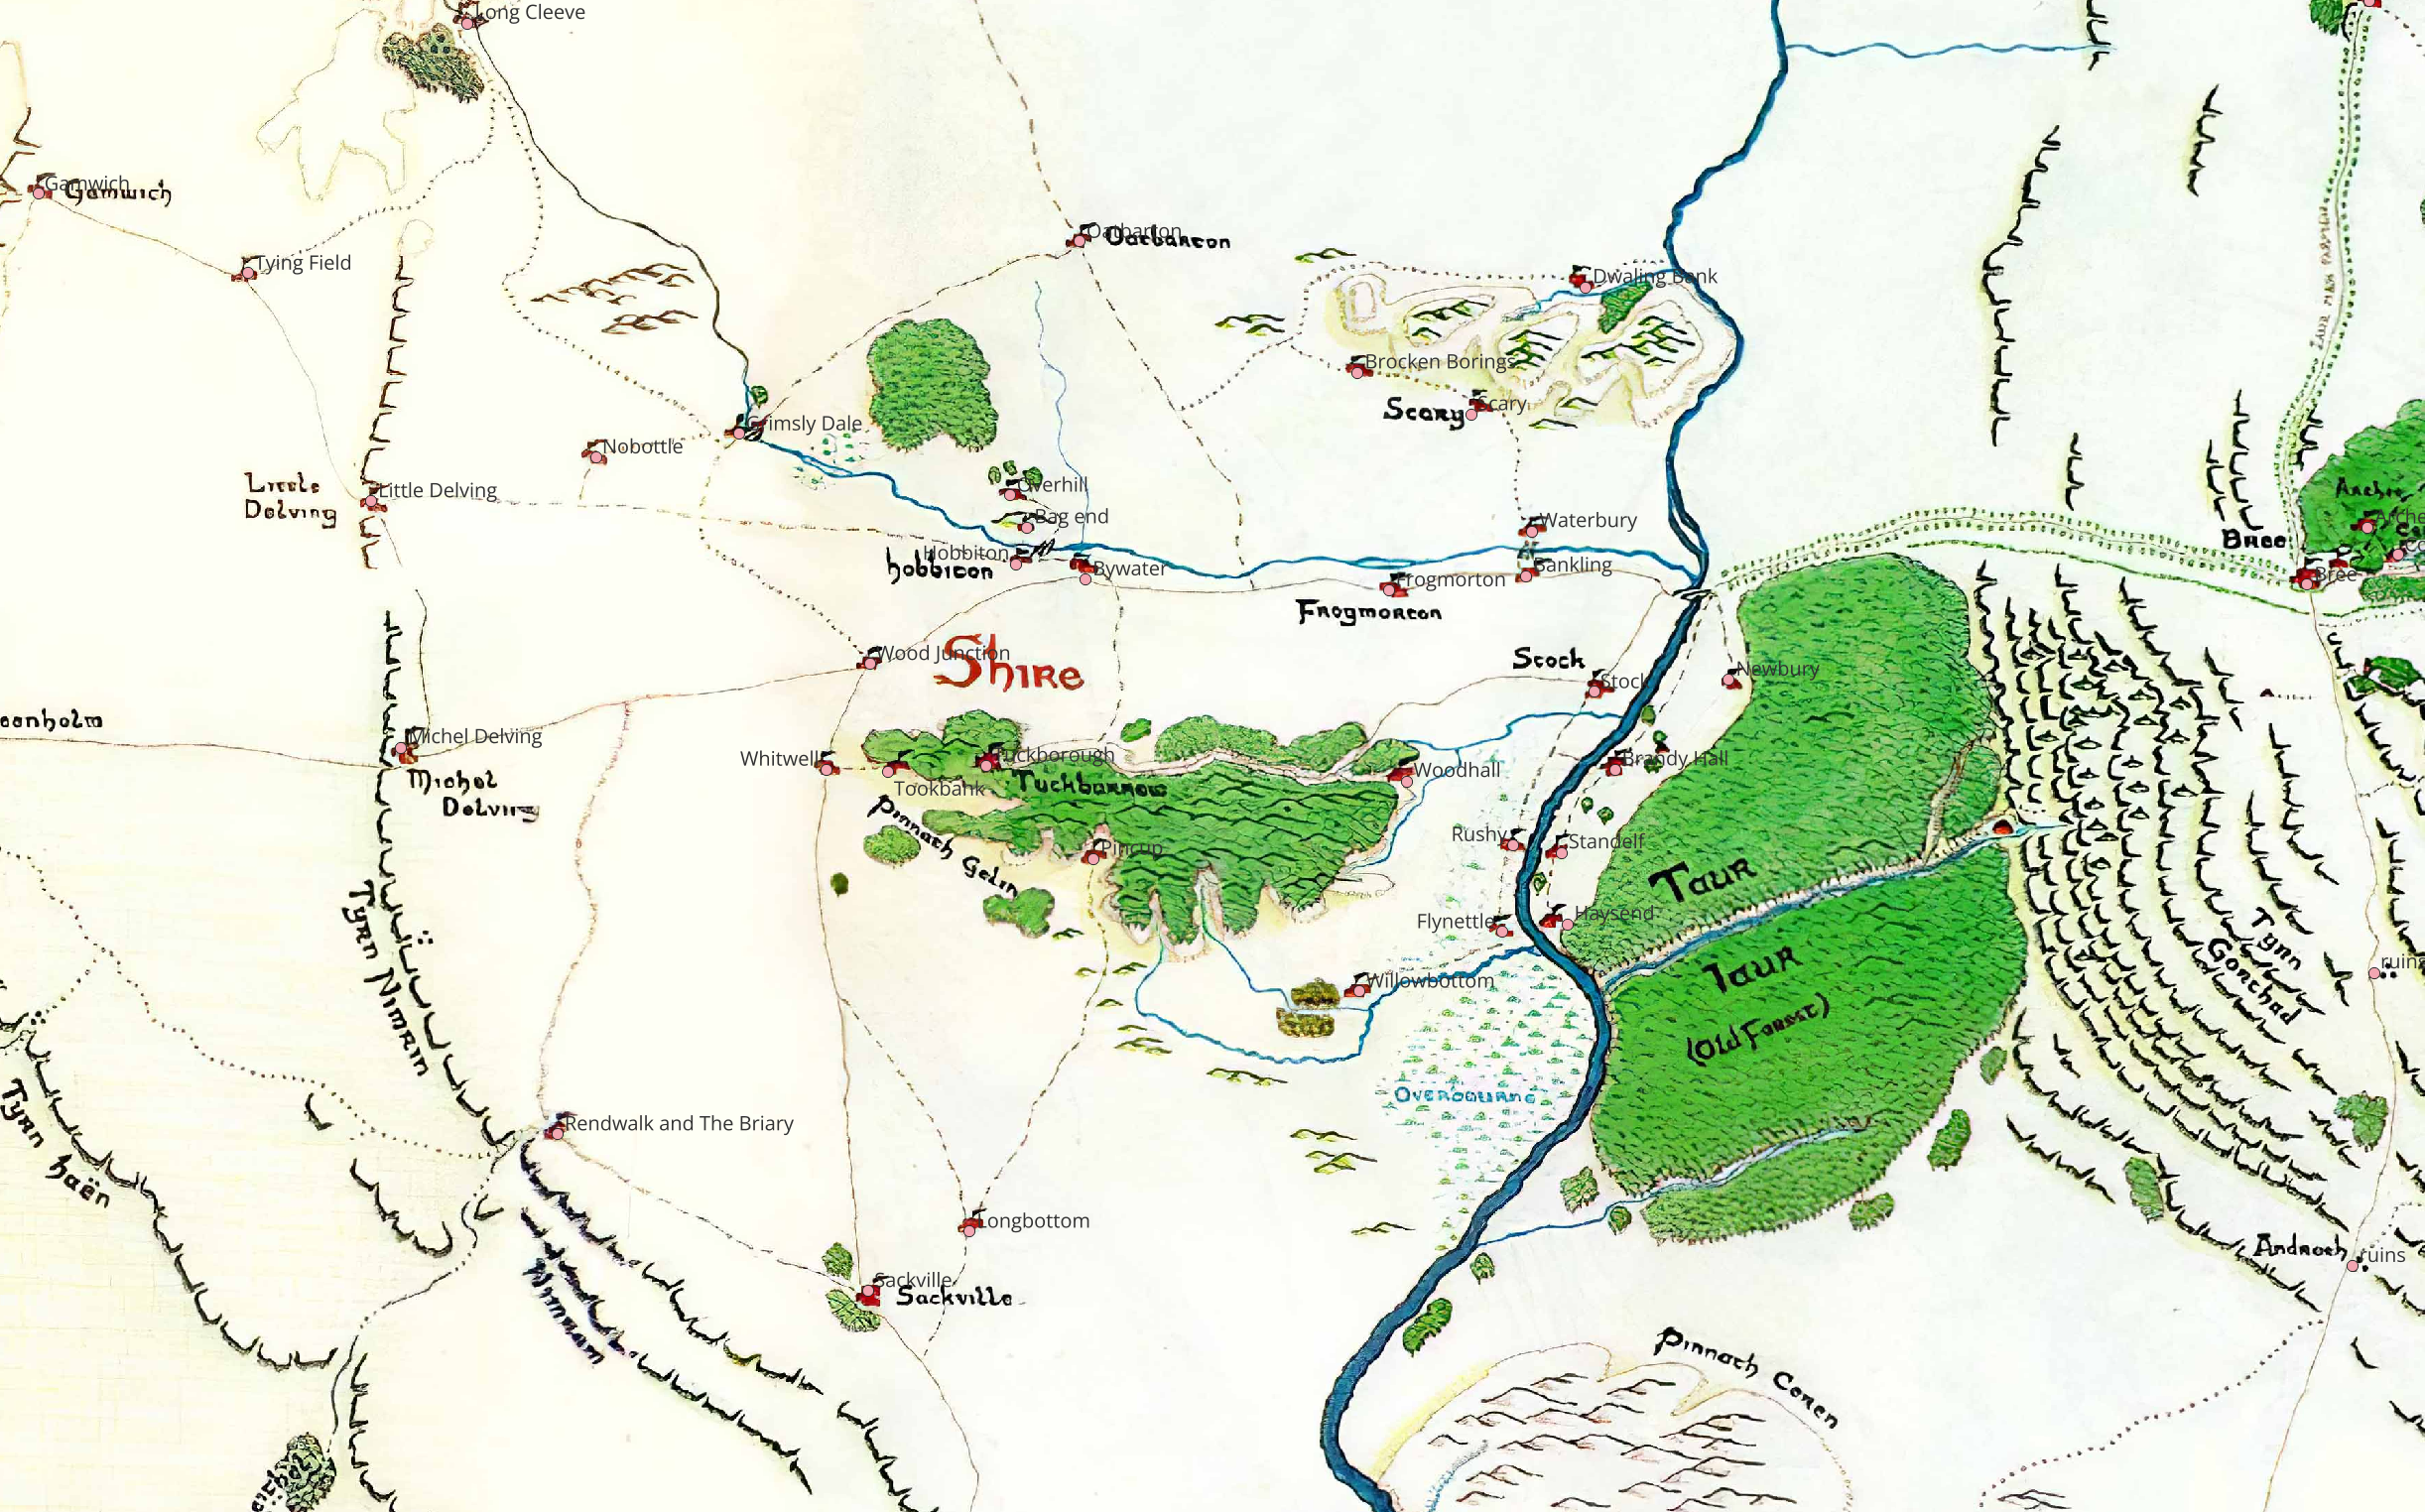
All layers are stored as PostGIS geometries with SRID 4326 and
GIST spatial indexes. I started by sourcing and cleaning a dataset
of Middle-earth locations, stored in the locations table as points
with name, type (city, fortress, ruin, mountain pass, etc.), population,
inhabitants, and narrative description.
Biomes and water
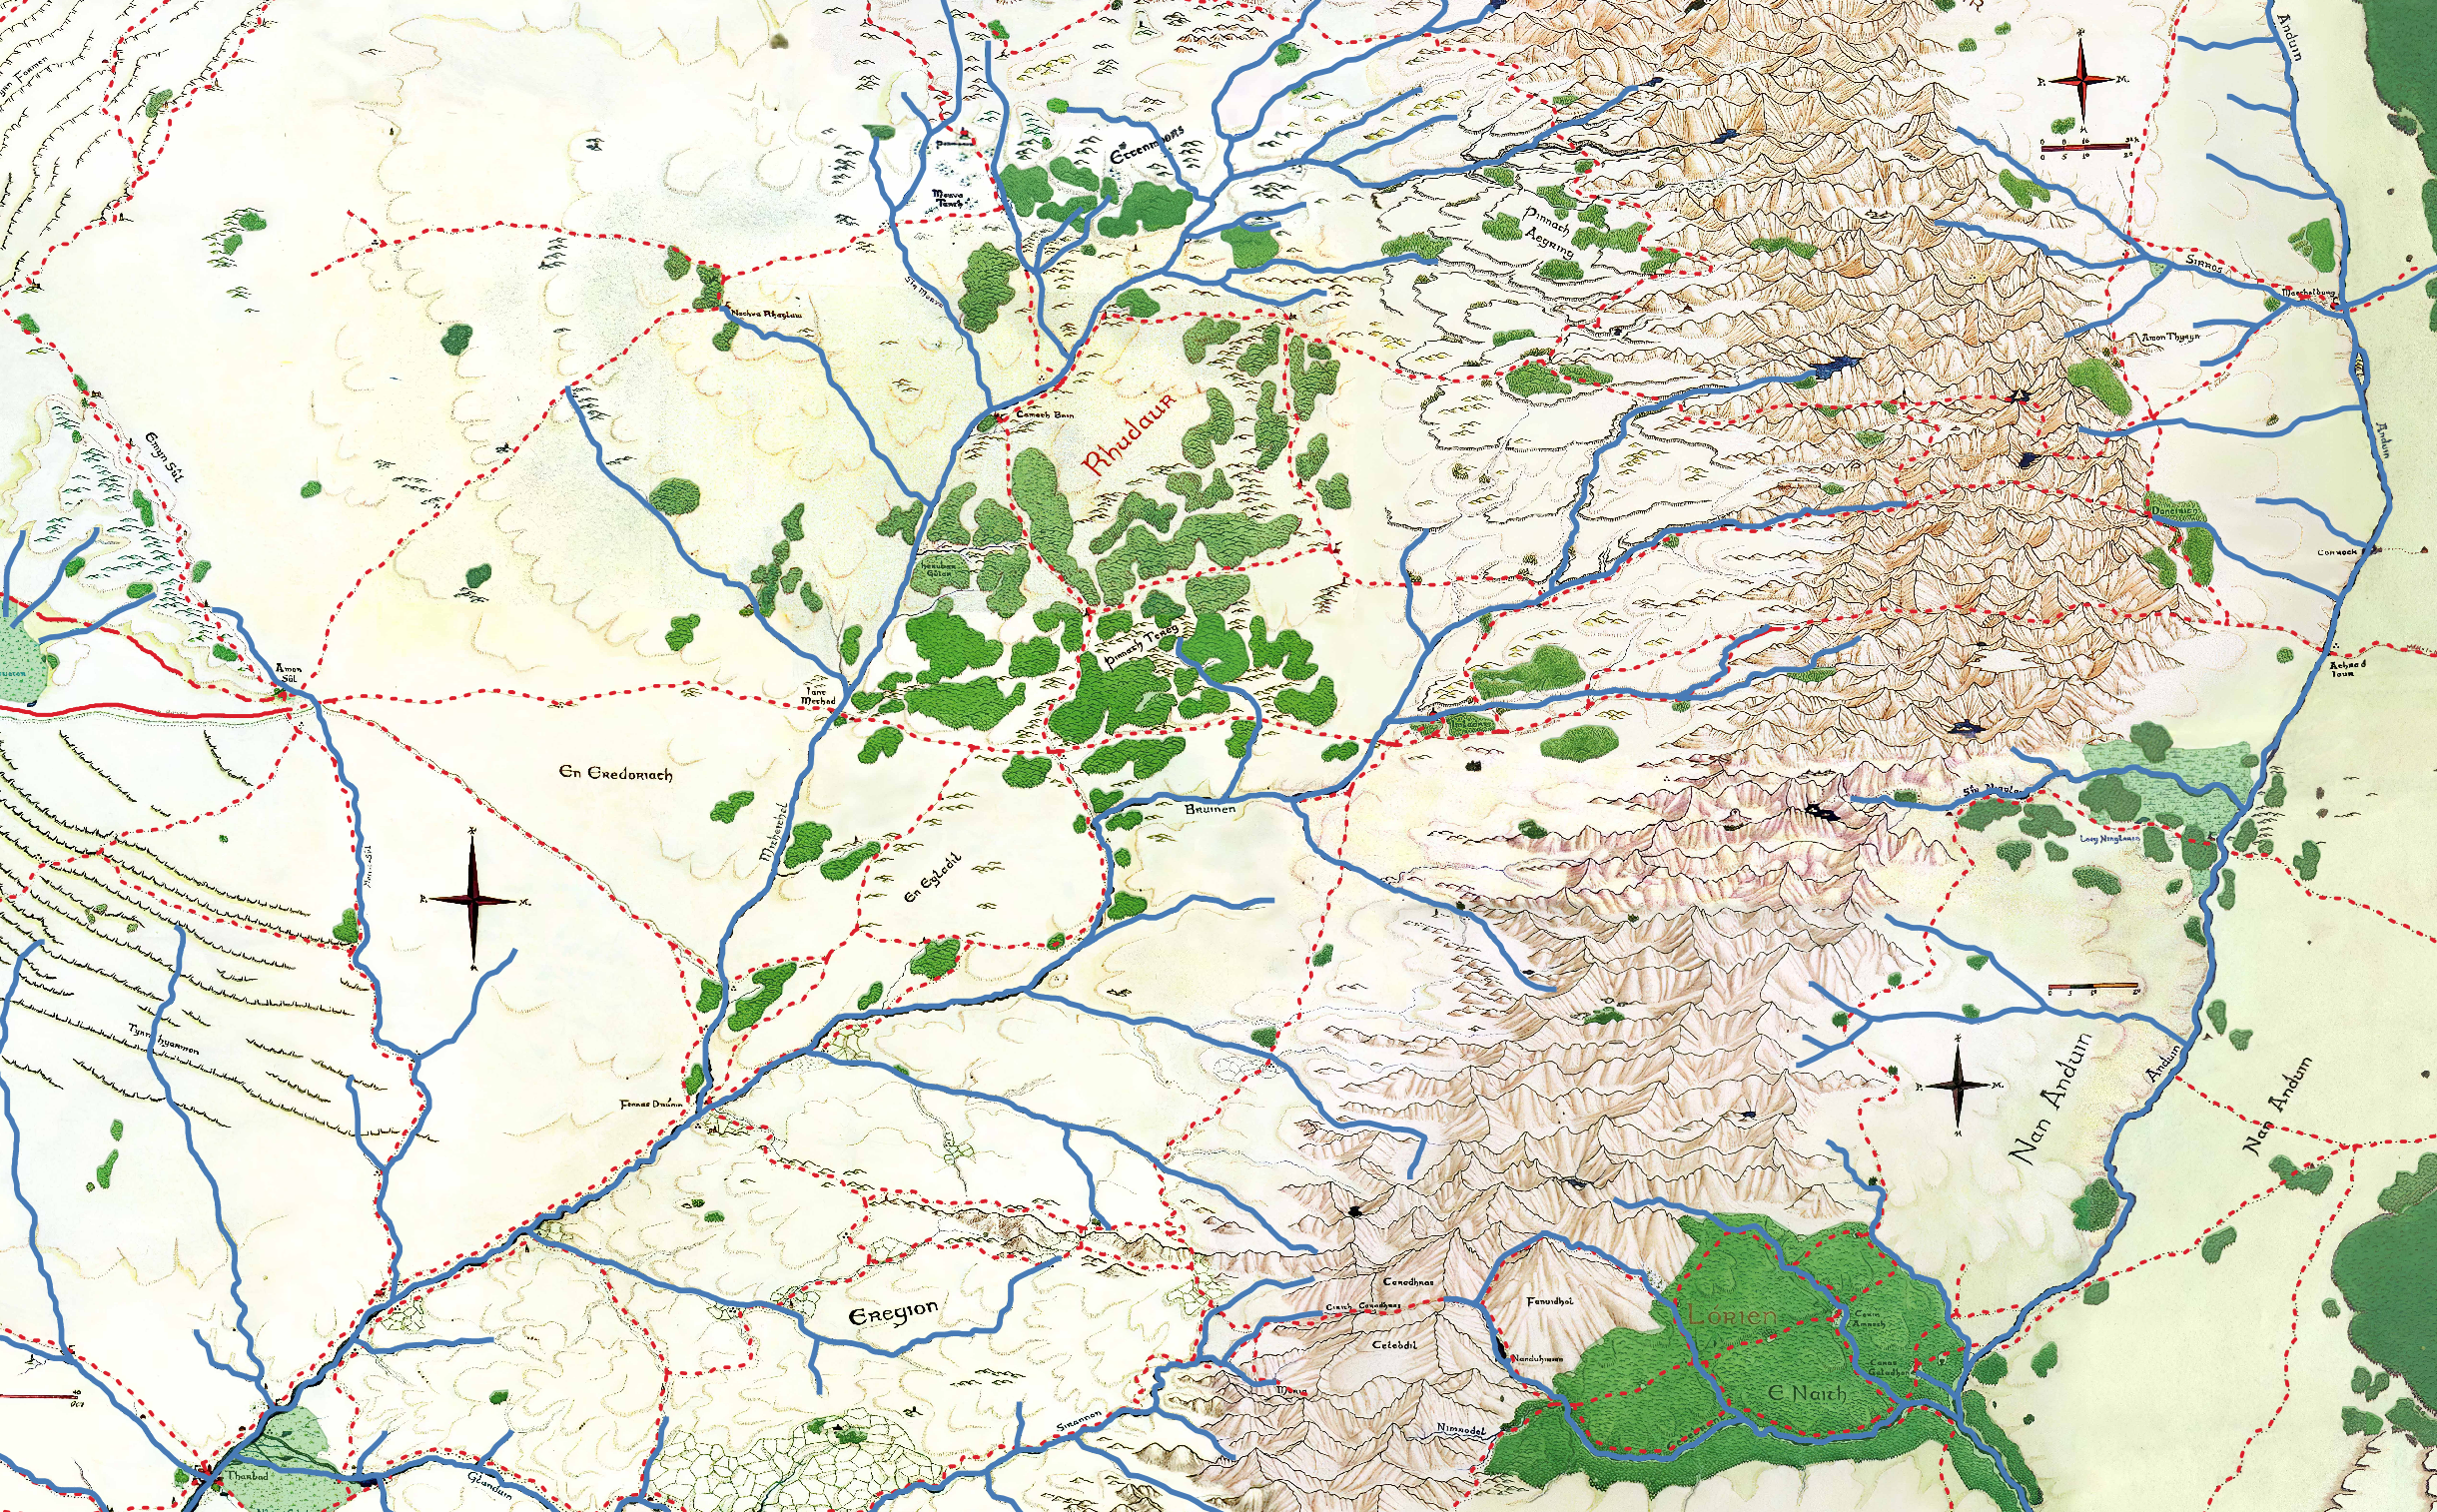
AI-assisted segmentation was used to trace the polygons of forests, marshes,
and deserts directly over the scanned map, stored in the biomes
table and rendered on the frontend as overlays. Water features were traced by
hand in QGIS following Fenlon’s original map. They live in the water
table with a generic geometry column that supports both LINESTRING (rivers and
streams) and POLYGON (seas and lakes). The road network was also traced by hand
and stored in the roads table.
Elevation system
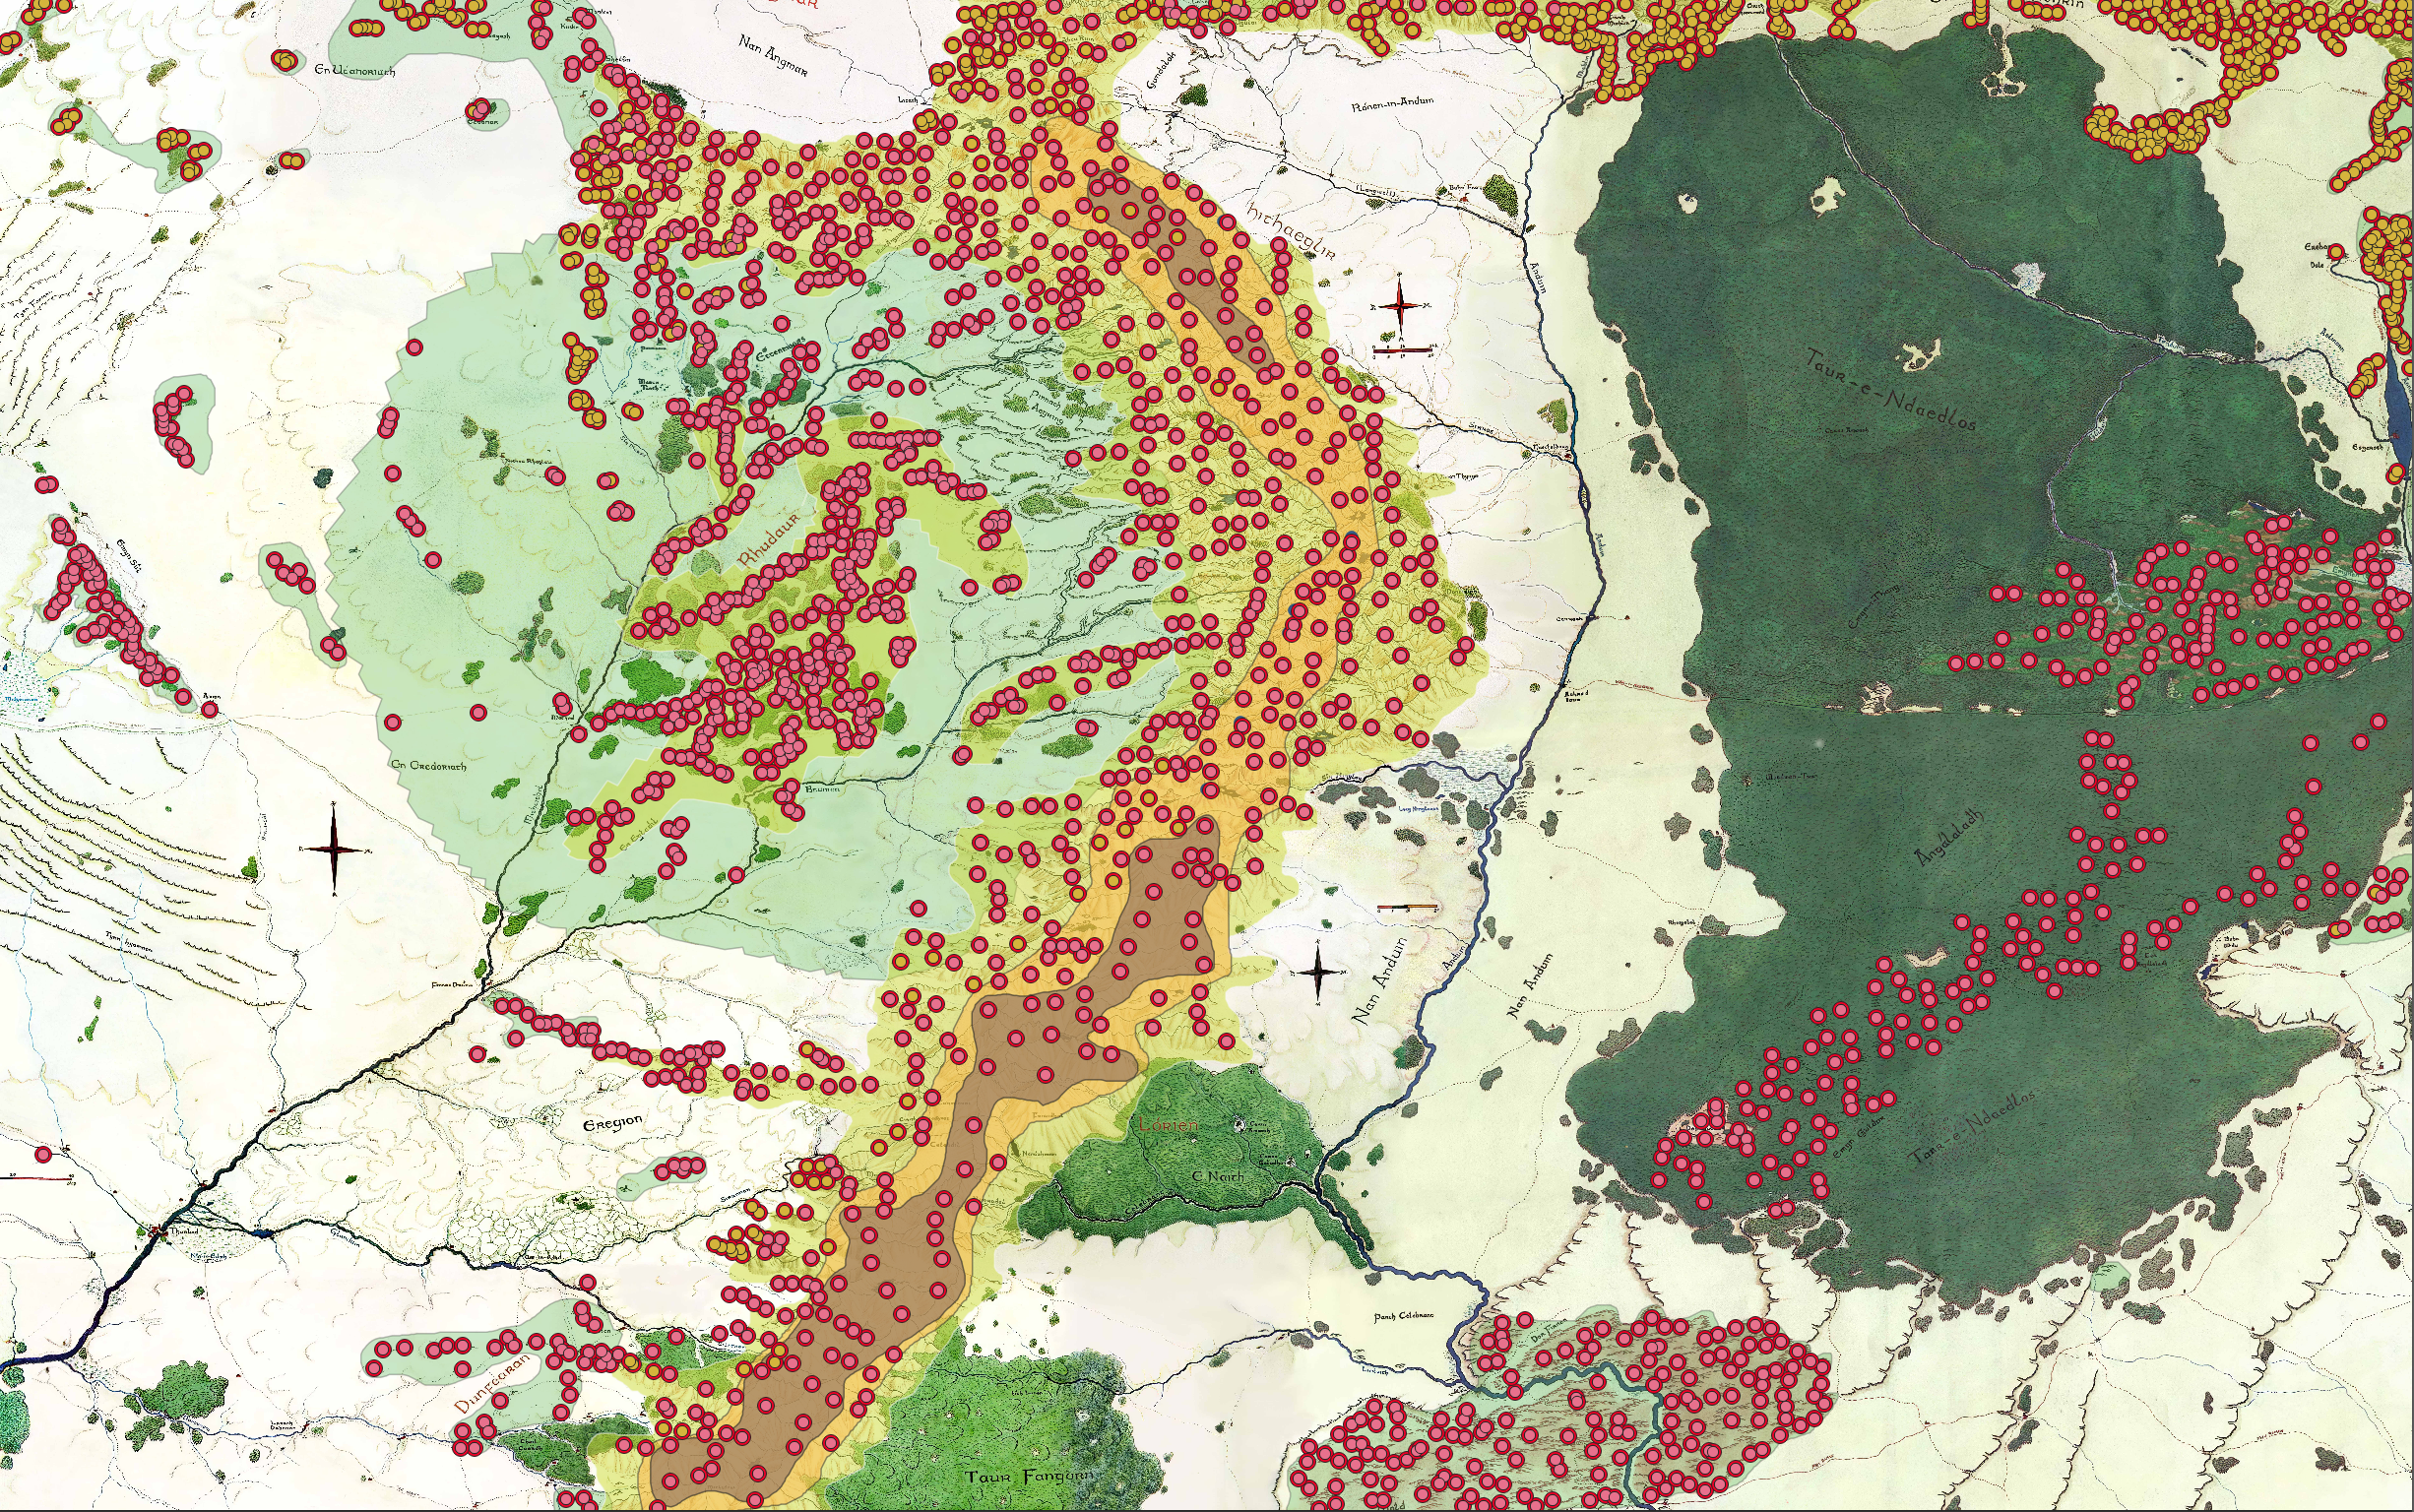
Polygon layers (altitude_layers) for different altitude ranges:
plains, hills, low/mid/high mountains with a priority field that
resolves overlaps. On top of those layers a DEM (Digital Elevation Model)
as a PostGIS raster (dem_elevation) was built, synthesized
from the peaks marked as points. The elevation of any coordinate is queried with
the SQL function get_elevation_at_point(lon, lat), and the API also
exposes elevation profiles that interpolate points every 100 m and compute
positive/negative gain.
See more: Creating the DEM System (peaks everywhere!)
Regions
Political regions are polygons generated with
polygonize in PostGIS from border lines. They include the associated
kingdom, climate zone, geographic/historical description, and encounter metrics.
Entities (creatures and characters) store arrays of the regions
and biomes where they appear and a JSONB field with encounter probability per
region.
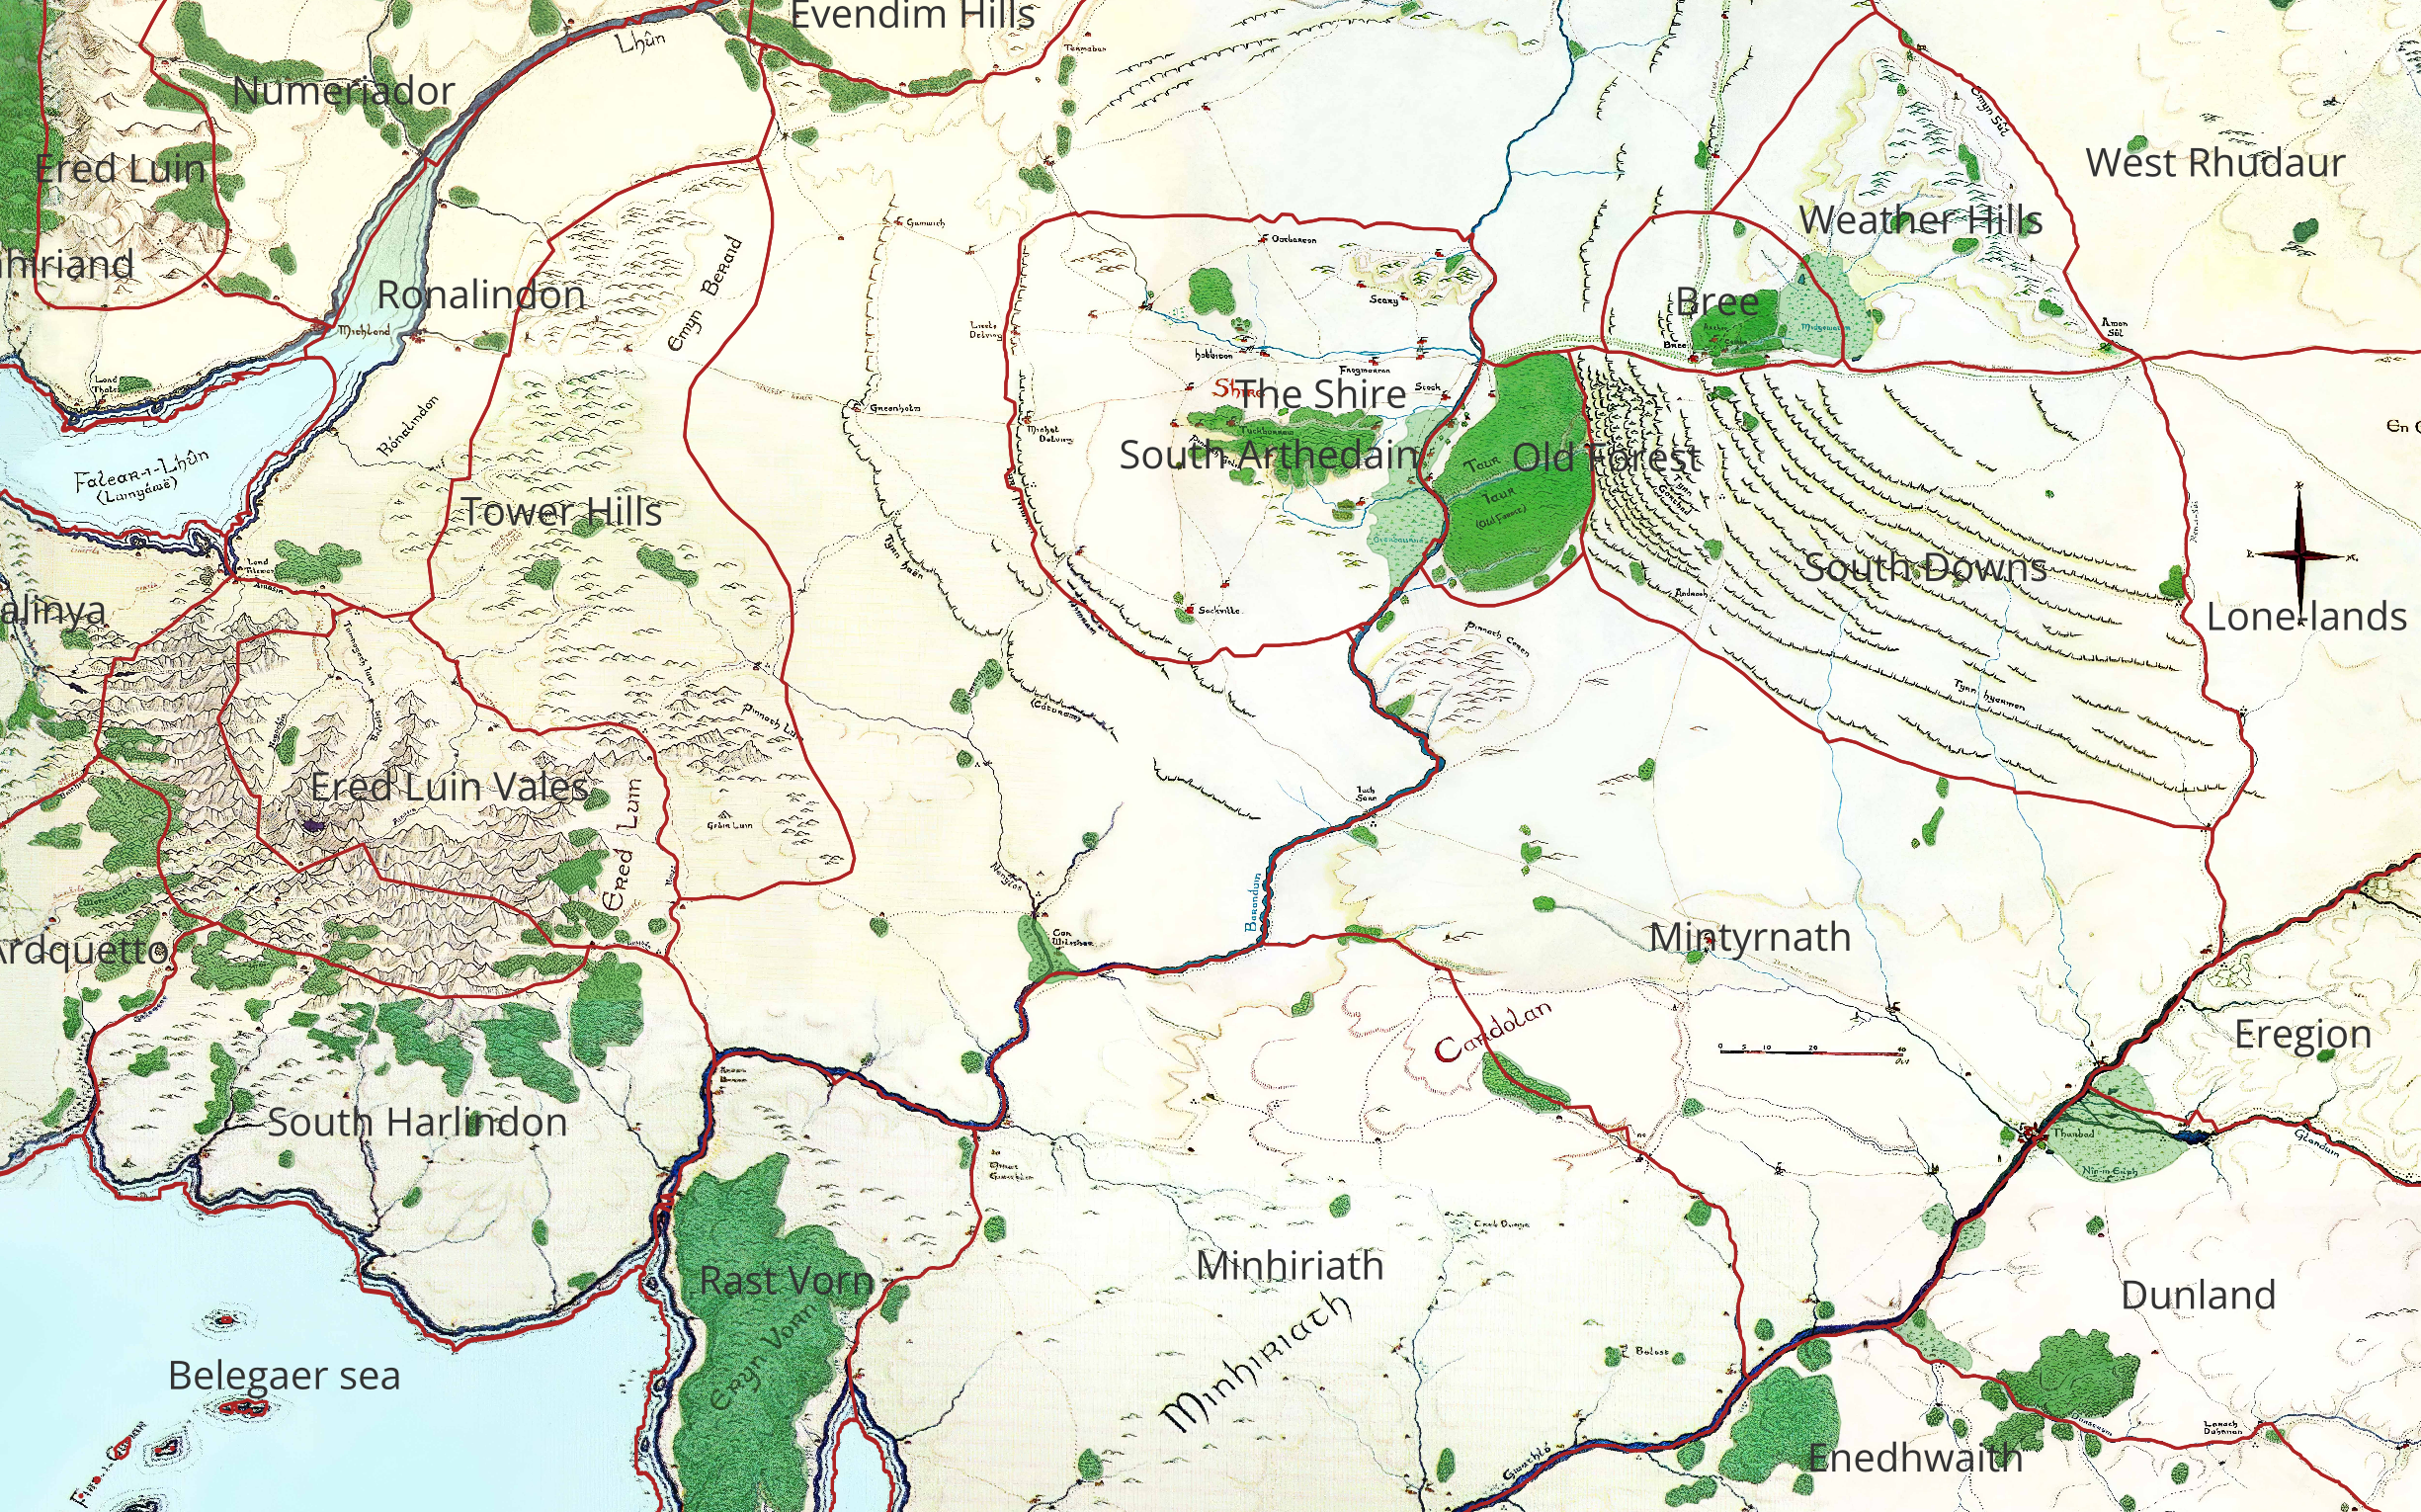
See more: Giving life to the map: entities and encounters
Climate system
The climate is based on real 1950 European climate data,
before the industrial and urban boom, using as reference the European coordinates
the map is superimposed on. Each region points to a climate_zone that
stores its Köppen classification and a real-world analog location.
The 1950 hourly weather data (temperature, humidity, precipitation, snowfall,
cloud cover, wind, pressure, soil moisture, radiation) lives in the
climate_data table, in the style of ERA5 / Open-Meteo series.
The “live” date is mapped to the year 1950 while keeping month, day, and hour, both on the client and the backend, to query the matching hourly record. This produces a climate coherent with a Third-Age Middle-earth: no urban heat-island effect and no modern pollution. A dynamic Middle-earth calendar updates live weather for all regions, and can be moved forward or backward to explore other times of the year, directly impacting travel cost and the AI narration.
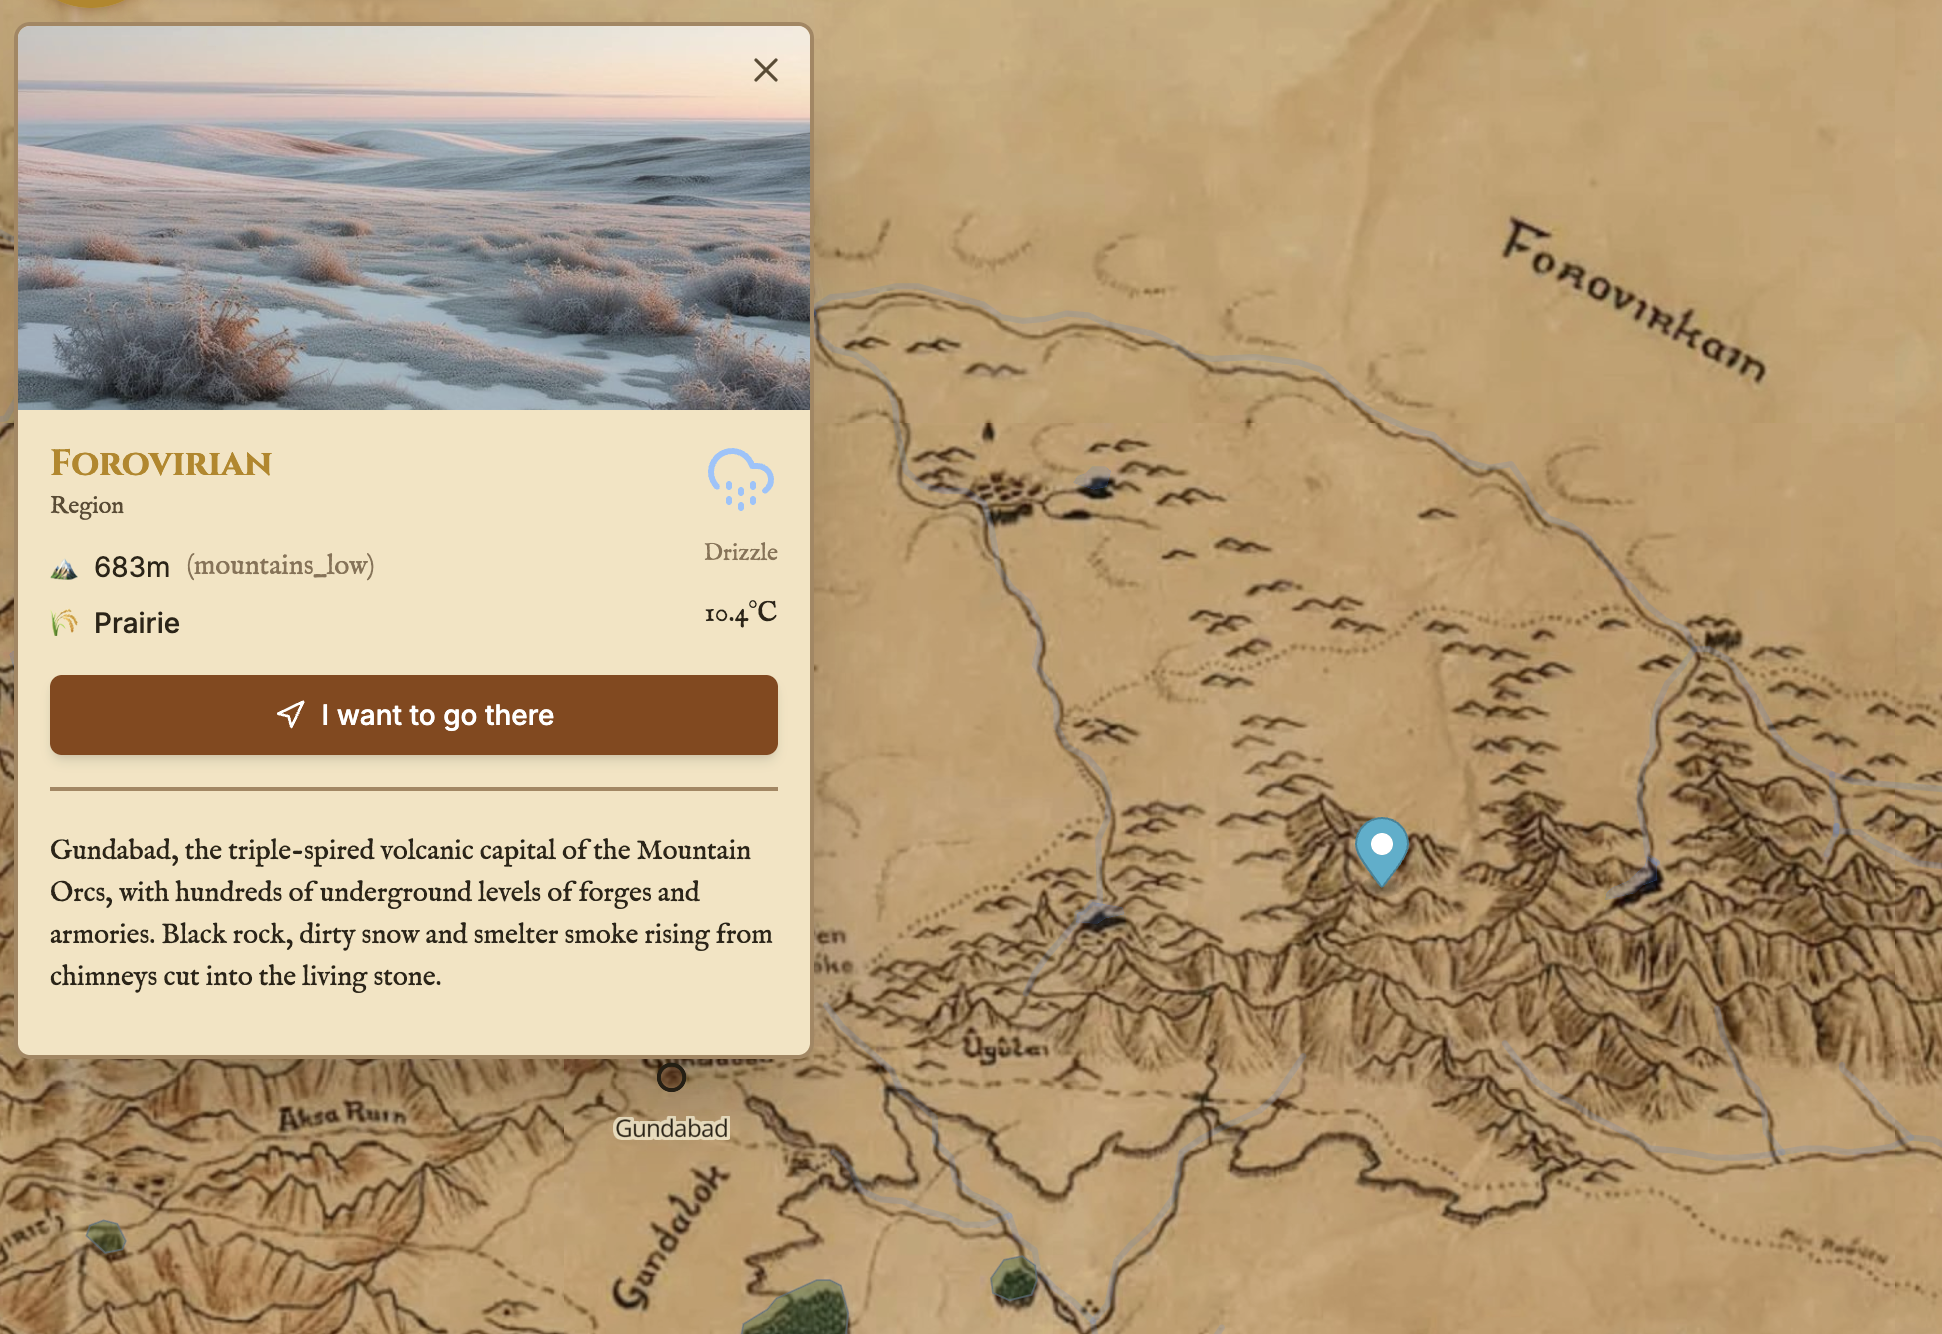
See more: How to create a Climate System from nothing
Route calculation
All roads are fetched from PostGIS and, through LATERAL joins with
ST_Intersects, each one is enriched with the biome and altitude type
it crosses. A graph is built from every pair of consecutive vertices of each road,
where the cost of each edge is the travel time:
speed = base_speed × road_mult × biome_mult × altitude_multThe shortest path is solved with a custom Dijkstra. The network holds 4,119 road segments classified into
four categories (Royal Road, Main Road, Regular Road, Trail) that reflect the
medieval road hierarchy, each with its own speed effect. Off-road legs are
penalized and measured with ST_Length over geography for precise
distances. Factors affecting cost: road type, biome, altitude and, upstream, the
weather and two modes of transport (on foot at 5 km/h, on horseback at 12 km/h).
The result is returned as GeoJSON with total distance, on-road/off-road distance,
and estimated time.
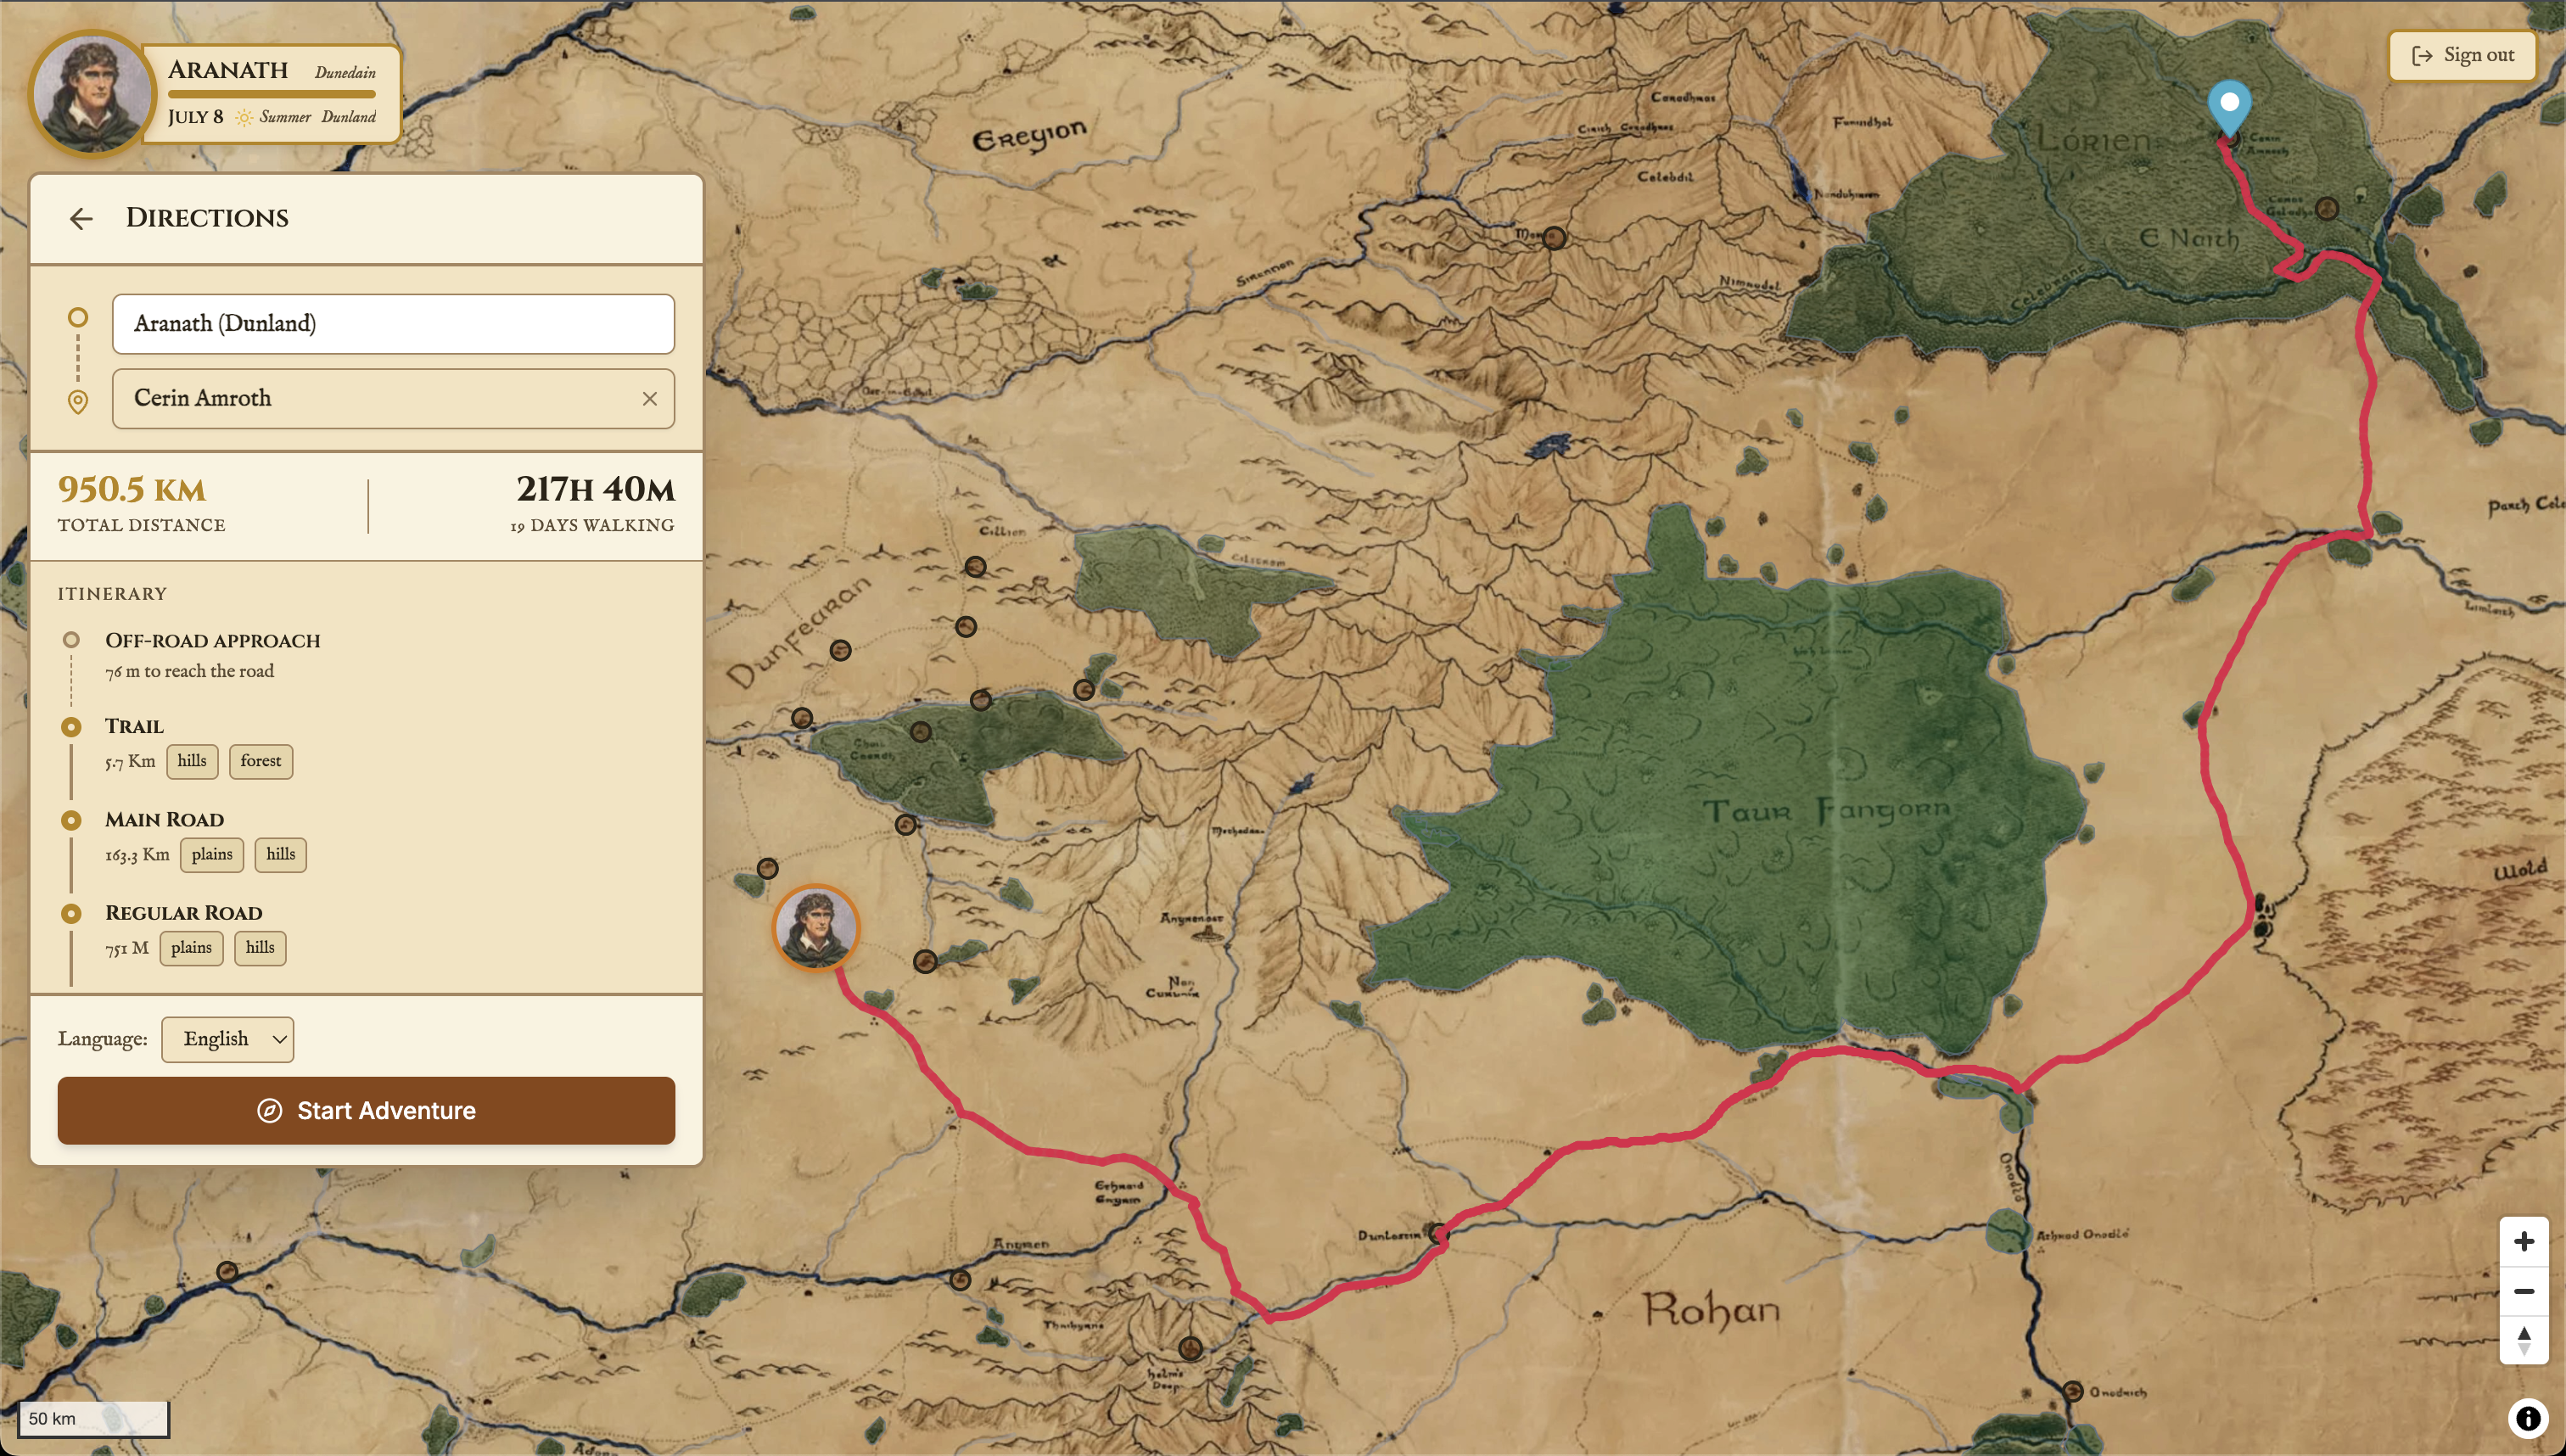
See more: Getting directions on Middle Earth (without passing through Mordor)
Characters and narrative
Two selectable characters each have their own stats, description, and narrative voice: The Noldo Elf immortal, of the ancient houses, offering the perspective of the long ages and The Dúnedain Ranger mortal, heir of Númenor, offering the perspective of everyday effort and danger.
The system generates a unique story for each day of travel
(one chapter = one day), built from the elevation, biome, and weather of the
traversed leg, the regions and locations crossed, the entities with encounter
probability, and the chosen character’s voice and backstory. The narration uses a
provider cascade with automatic fallback: Gemini 2.0 Flash as the
primary provider and Groq (llama-3.3-70b-versatile) as a fallback when
rate limits are hit. A simple energy system governs encounters: one hit halves the
energy, two hits are fatal, and full recovery requires five days of rest.
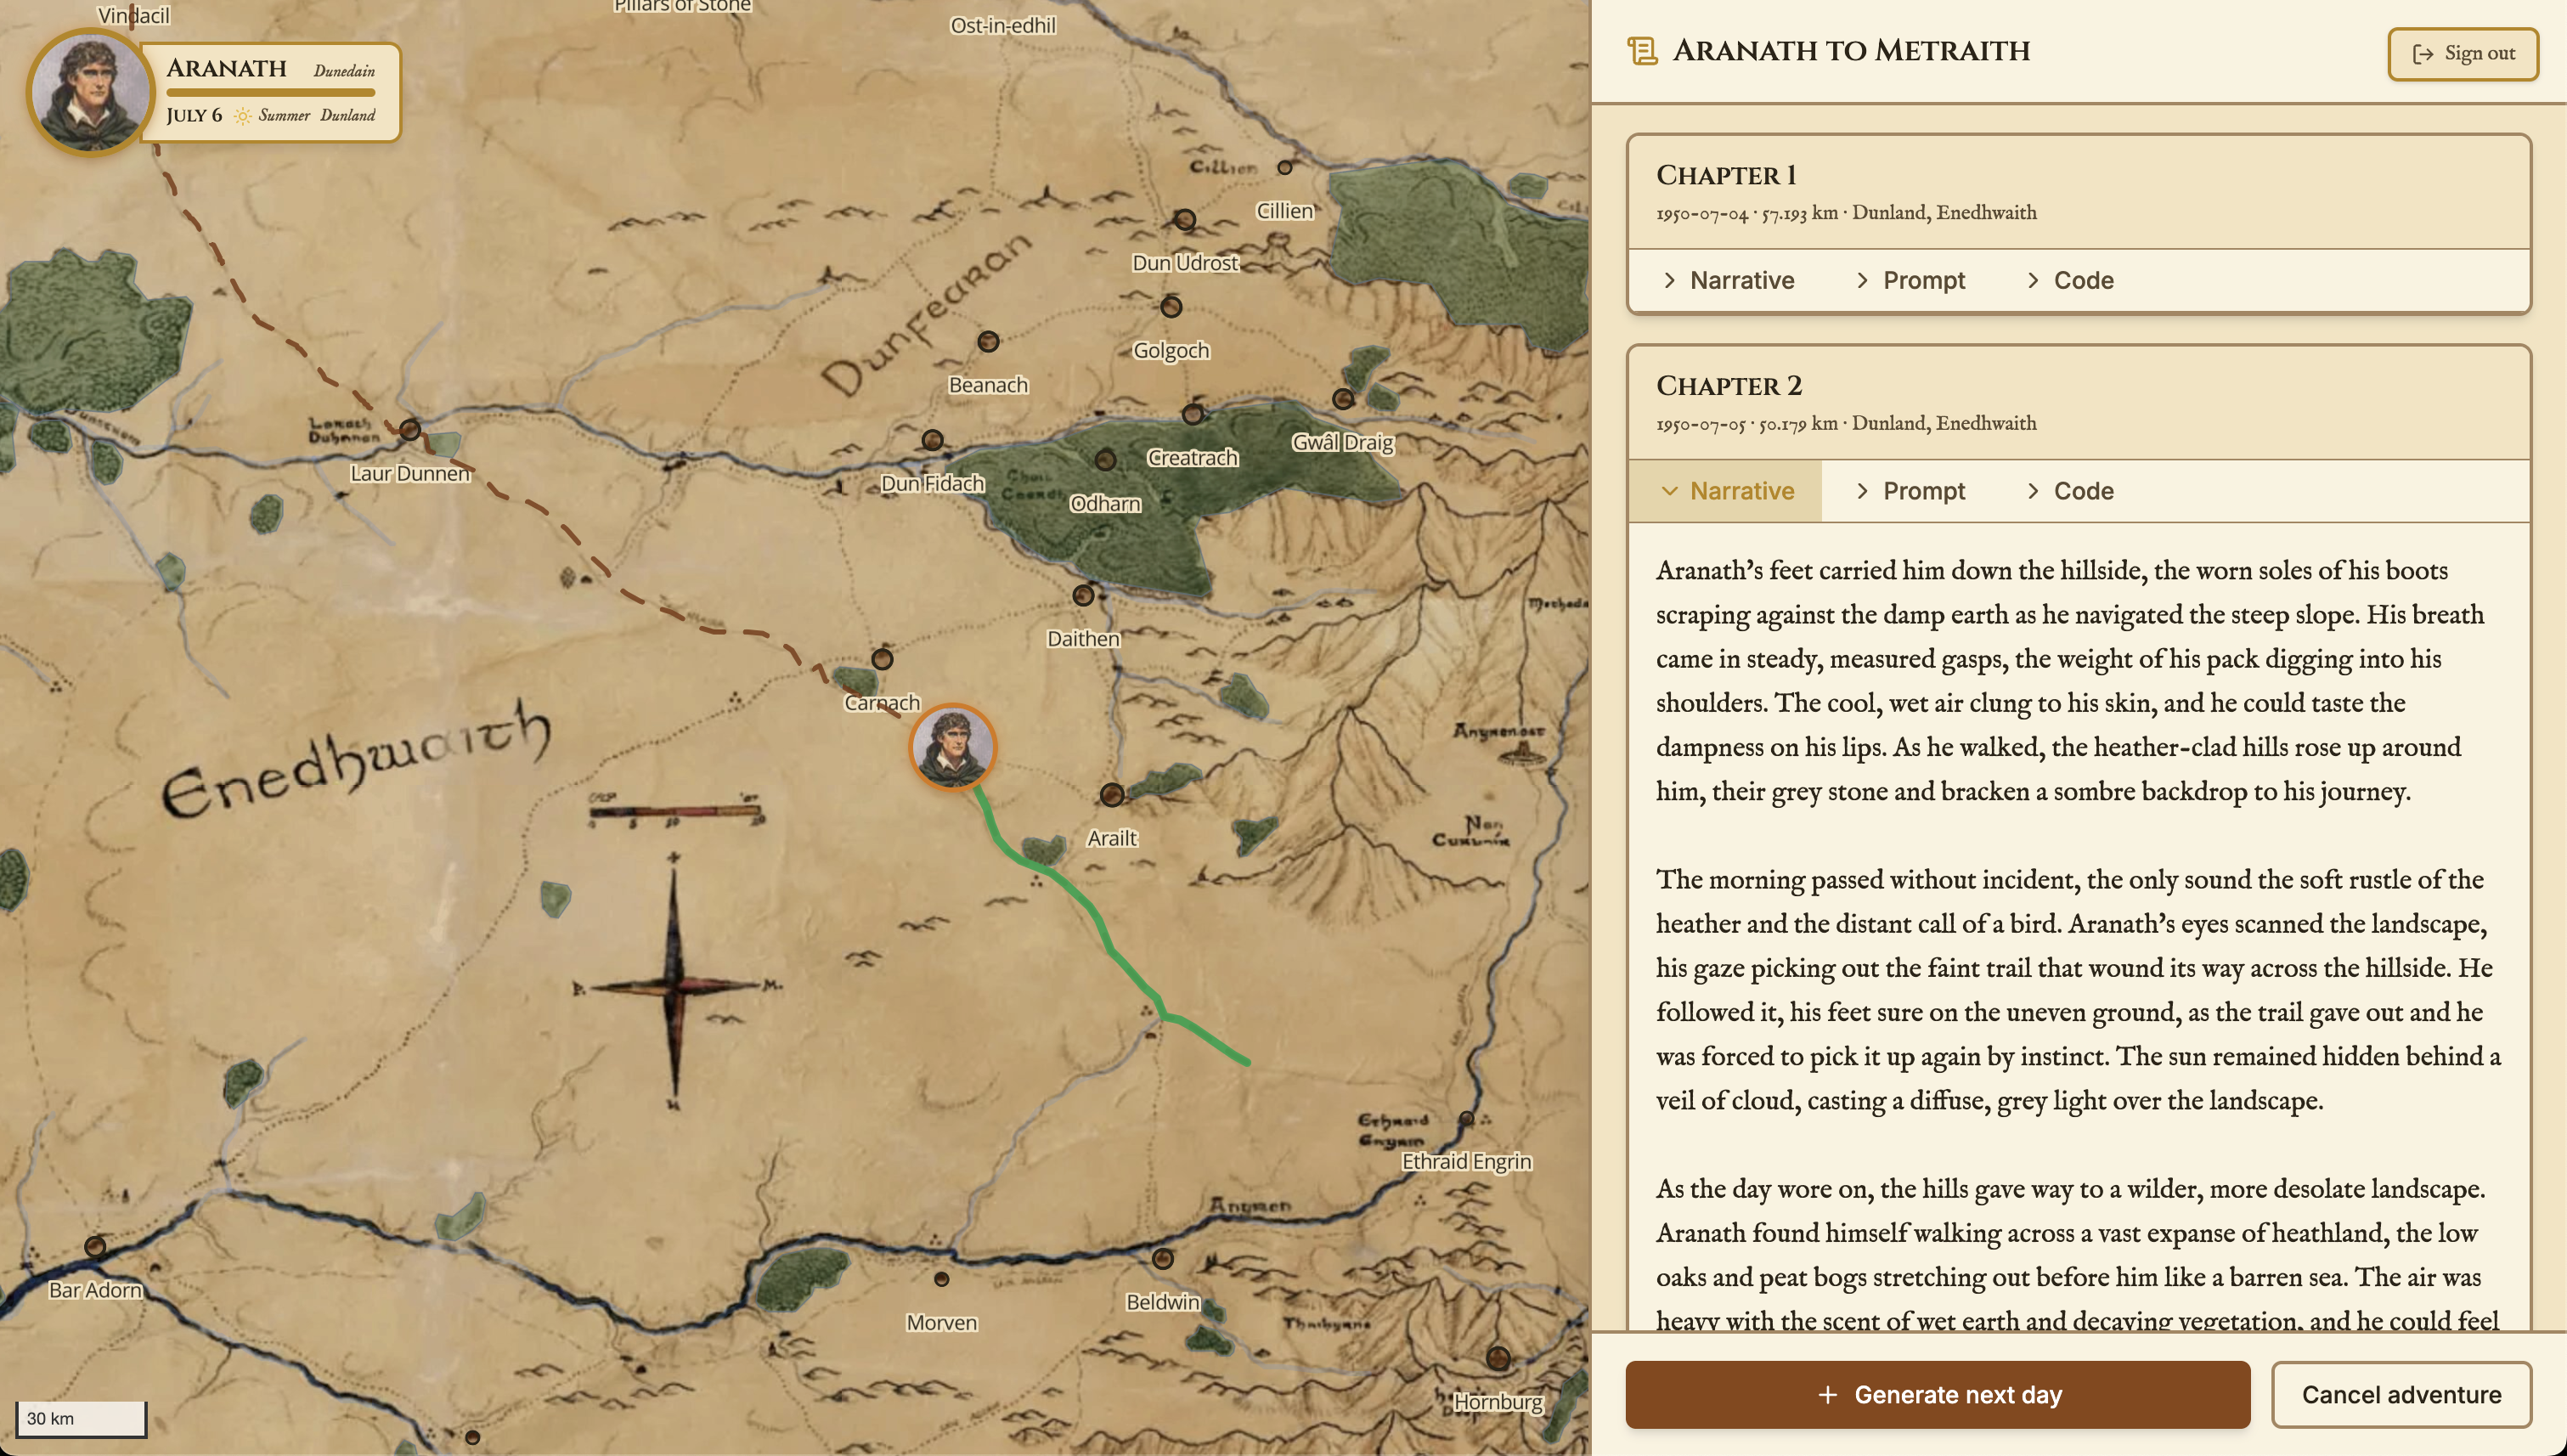
See more: Prompting and narrating like Tolkien from raw GIS data
Technical architecture
1. Frontend
- Vue 3 (Composition API) + TypeScript + Vite, in a Feature-Sliced Design architecture
- MapLibre GL for the vector map, with Turf.js for client-side geometry
- TailwindCSS + Reka UI (shadcn-style headless components) + Lucide icons
- Shared state handled with composables (no Vuex/Pinia), several with singleton state
2. Backend
- Node.js + Express (ESM), domain-modular / feature-slice architecture
- One Express router per resource, mounted under
/api/* - Heavy business logic in services: routing (Dijkstra + terrain costs), AI cascade, day-by-day trip construction, encounters
- JWT verification middleware; geospatial logic delegated to PostGIS via
pg
3. Database
- PostgreSQL + PostGIS, normalized relational model, all geometries in EPSG:4326
- GIST spatial indexes plus B-tree/GIN depending on the query pattern
- Vector + raster tables, SQL functions for reusable geospatial logic
- Geometric integrity constraints (
ST_IsValid, SRID checks)
4. Exploration and users
- Map explorable with and without login (JWT + bcrypt, 7-day tokens)
- Unauthenticated: regions, locations, biomes, climate, altitude
- Authenticated: routes, characters, narration, and travel history
- Containerized with Docker and deployed on Railway
Objectives
- Georeference Pete Fenlon’s map onto Europe with real coordinates and precise measurements
- Build a historically coherent climate system based on real 1950 data
- Model Middle-earth’s geography in PostGIS layers (biomes, water, elevation, regions)
- Compute realistic routes considering biome, altitude, weather, and mode of transport
- Generate unique per-trip narratives using AI anchored in the map’s data
- Create an interactive exploration experience accessible with and without login
